
EarthChem Library Documentation
The EarthChem Library (ECL) is a curated file repository, you will receive your dataset DOI only after your files and submission has been reviewed and accepted. Please keep in mind that this entire process can take up to two weeks. Complete datasets following all requirements are often published within a few business days.
ECL Data Submission FAQ
The EarthChem Library is a domain repository which primarily serves the geochemistry community. Data types include bulk elemental analysis (majors, traces), bulk isotope analysis, mineral analysis (in-situ analysis), melt inclusion analysis, and many more. Please send us a message at info@50.16.114.67 to check if your data is best represented in the EarthChem Library. We are not able to accomodate software, code or figures at this time.
Allowed file extensions are can be found at this link.
Tabular data should be in an ECL template, but must at the very least be in a .csv, .txt, or .xlsx file (not in .pdf, .docx, .jpeg, etc.).
Please check your spam/junk folder. If you don’t get a notification from us in the first 24 hours please reach out to info@50.16.114.67.
You will receive your dataset DOI only after your files and submission has been reviewed and accepted. Please keep in mind that this entire process can take up to two weeks. Please try to submit your data ahead of when your publisher requests it!
Yes! Your data can be embargoed for up to two years from your submission date. There will be a public landing page that points to it, but it will not be available until the release date you chose.
Yes! You can let us know the status of your publication (in prep/submitted/in review/accepted) and once your paper is accepted notify us to update the final details of the citation at info@50.16.114.67.
Yes! Login into MyECL, select your submission and update the Primary Publication DOI field.
You can add multiple DOIs here separated by semicolon with ‘doi:’ prefix. (e.g. doi:10.016/j.epsl.2009.11.018;doi:10.1016/j.epsl.2018.04.035)
Method codes identify the [Technique]-[Instrument]-[Laboratory] trio.
If you have multiple parameters analyzed on the same machine using the same technique, in the same lab, both parameters will have the same method number (code).
Example: Sr and Nd measured using VG Sector 54 TIMS at the University of Columbia would have method code 1, but Sr and Nd measured on Thermo Fisher ICP-MS at the University of Columbia would both have method code 2.
Yes! Please make sure that every data point is properly cited and have a full reference list that accompanies the data.
Couldn't find an answer to your question on this page? Contact us at info@earthchem.org.
PetDB Documentation
PetDB is an integrated data synthesis through which you can access chemical, isotopic, and mineralogical data from peer-reviewed literature.
PetDB FAQ
PetDB provides access to
- major oxide, trace element
- isotopes, age, and modal data from igneous and metamorphic rocks
- xenolith samples from the Earth’s mantle and lower crust
- ophiolites
The analytical data are complemented by associated metadata which provide information on how the data was obtained, including information about the sample, analytical method, rock texture, literature reference, and geographic location.
PetDB search facets are meant to be intuitive, but please see our tutorial for tips on how to get started.
If you would like to suggest a reference that is missing from PetDB, please email us at info@petdb.org.
EarthChem databases contain data that have appeared in the public record. This includes journal articles, monographs, ODP briefs, masters and doctoral theses. EarthChem cannot guarantee the accuracy of reported data beyond peer review at the publication and committee level. We strongly urge users to use the same level of critical judgment as they would with any other kind of published data.
Precompiled datasets group together analyses for samples, even if published in different papers. Datasets that are not precompiled are listed in individual rows and require much more post-download manipulation prior to analysis.
Precompiled datasets undergo a database script that selects data according to data quality. For example, if potassium in a sample has been analyzed by both x-ray fluorescence (XRF) and wet chemistry (WET) the precompiled routine will choose the XRF data for its higher quality. These sets are particularly useful to educators and researchers who want to analyze data quickly without extensive processing of the downloaded spreadsheet. For more information on precompiled datasets please see our tutorial.
Yes. PetDB is a member of the EarthChem federation of geochemistry databases and is part of a larger community of cyberinfrastructure projects that provide open access to geoscience data.
EarthChem Portal: Integrated geochemistry data from PetDB, SedDB, MetPetDB, GEROC, NAvDat, USGS, and GANSEKI
EarthChem Library: open-access repository for geochemical datasets (analytical data, experimental data, synthesis databases) and other digital resources relevant to the field of geochemistry
NAVDAT: Geochemistry of volcanic rocks from the western United States
GEOROC: Geochemistry of rocks from the continents and oceans
MGDS: Marine Geoscience Data System – MARGINS data portal
Geochron: Geochronology and quantitative chronostratigraphy
SedDB: Geochemistry of marine sediments from across the globe
SESAR: Sample Registry for IGSN (International GeoSample Numbers), cataloguing and preserving sample information
LEPR: Library of Experimental Phase Relations
You can download GeoMapApp free of charge from the Marine Geoscience Data System website. GeoMapApp is software that allows the user to visualize data in a number of different ways. Instructions on how to install and use the tool are available on the website.
PetDB Tutorials
Setting constraints on a sample selection
To query the database for chemical values, you first need to select the samples in which you are interested. The following criteria can be used (you can use one criteria or a combination of criteria):
- By Location: Search by creating a polygon on a map, or by entering latitude and longitude as bounds or pairs
- By Feature: Use geographical names to define a specific geographical area for your sample selection. Geographical names are used on various regional scales ranging from the name of a volcanic province to an ocean or the name of a seamount
- By Sample Type: Search by rock classification and mineral species
- By Chemistry: Set ranges of chemical variables for your search, or query for all samples analyzed for a variable
- By Tectonic Setting
- By Age: Search by age span, exact age, geological age, or query for all samples with an age determination
- By Cruise or Field Program
- By IGSN: Use an IGSN to query for data for that sample
- Reference Lookup: Search by Author, Year, Title or Journal
EarthChem Portal Documentation
The EarthChem Portal is a one stop access point to multiple geochemical systems.
EarthChem Portal FAQ
Q: I am a regular user of the Earthchem portal. Just to inform you that I have noticed a “little bug”. When you do any kind of query the min, max and mean age are sometimes negative in the resulting dataset… For instance, I have downloaded recently 350000 sample for various data (Sr, Rb…) and out of 350000 more than 5000 samples have negative age. It looks like some data entered are under the form 300 +-0.00345 and in this case when downloading the data the age return is -0.00345. Have you experience this issue before?
A: Negative values represent a year age of a sample, instead of an MA representation. For example, a sample with an age of “-0.000065” would be 65 years old (at the time of publication). Most of these negative values come from NAVDAT and GEOROC and the ages come from a known eruption event.
Q: I’m trying to enter a glossary entry so that I can easily search for data in the Aleutians. The draw polygon option cuts off the map at 180 long, so it doesn’t include the entire area. If I try to enter the lat/long coordinates, it doesn’t understand to continue across the 180 degree line. It tried to connect the polygon to the opposite side of the map across N America, Europe, Asia, etc. I have the same problem with New Zealand. I don’t see a way to currently search Earthchem without splitting the entry into two polygons, which may cause duplicate or missing data from the search.
A: ***UPDATE*** The portal has been updated so that the map can scroll across the dateline now. *** Original answer: Problems with crossing the 180 degree longitude line is a known issue on the polygon map, and we apologize for any frustration that it has caused. Unfortunately, the issue lies within the spatial software that we use, and there is no easy fix at this point. For the time being, the only workaround is to use two polygons as you suggest below. This issue is currently being investigated, and I will let you know as soon as a solution is available.
Q: Are the Pb isotope ratios accessible through Earthchem raw ratios or age-corrected?
A: If the parameter name is appended by an (I) or (T), that means that the ratio is corrected for I = Initial age or T = age at time T (e.g. 50Ma). If the parameter name does not have any parenthetical appendix, then the author did not specify that the ratio was age corrected. In the PetDB database, if the parameter is appended by (T), there should be a comment in the methods section that indicates what the T time is.
EarthChem Portal Tutorials
You may view how many times data associated with a specific author or publication have been downloaded by unique IP addresses by clicking on the Citation Search left-hand menu item. Simply enter reference information to obtain the number of downloads. The details button next to each reference provides additional information on the number of downloads per IP address and dates when the downloads occurred.
You can set any combination of the following:
- Reference and Keyword Search: Use this query parameter if you know the specific year, author, journal, or keyword that contains the data you are looking for.
- Location: The location query allows you to retrieve data by selecting an area on a map by defining a polygon, inputting specific geospatial coordinates, or by browsing geographic locations defined in the EarthChem Gazetteer.
- Rock Type: Search by material type and associated rock types using names provided in the publication or by TAS diagram classification.
- Chemistry: Query the global dataset for specific chemical items and range of values.
- Glossary: Click on the left-hand menu to search by glossary item or define your own. Simply register or login to create a reusable query.
- Material: Choose between bulk composition, whole rock/rock, glass/groundmass, or glass/inclusion
EarthChem’s Portal offers access to geochemical data in federated geochemical databases, including PetDB, GEOROC, NAVDAT, SedDB, the Deep Lithosphere Dataset, the USGS National Geochemical Database, MetPetDB, and the GANSEKI database.
This tutorial explains how to extract an integrated table of your desired geochemical data.
The two main steps to getting your integrated dataset are:
- Constrain sample selection
- Choose the data display and geochemical parameters
1. Constrain Sample selection
Sample selection is set on the Portal Search page.
The sample selection can be constrained by:
Reference | Keyword | Sample ID | Location | Geologic Province | Ocean Feature Name | Volcano Name | Sample Type | Chemistry
Reference
Obtain samples that were reported in a particular reference (article, report).
- Author: should be an exact match of the last name (e.g. Shaw)
- Title: full title or title fragment
- Journal: full journal name or name fragment
- DOI: e.g.: 10.1016/0012-821X(95)00023-6
Keyword
The keyword query searches a generic descriptor field contained in the EarthChem schema. This is a free-text field that allows the supported datasets to provide a descriptor of their own choosing. Most often, this field contains a short sample description providing the sample’s location and composition. The keyword search also includes rock name in the queried results.
Sample ID
Sample IDs are the names used by the federated databases. The different databases have their own conventions, but if you have the sample ID from a particular database, you may search for it here. The sample name must be the complete name (not a fragment). The search will return samples with similar names, (common typos such as 1 for lowercase L), and dashes do not matter, for example, ML12 will return ML-12 and M112.
Some databases use a repeatable convention for unique sample naming, PetDB typically gives some combination of Ship, Expedition/Cruise (name or leg), station, and sample, for example,
ODP0176-0735B-001R-001/035-037
Ocean Drilling Program, leg 176, hole 735B, core 1R, section 1, 35-37 centimeters
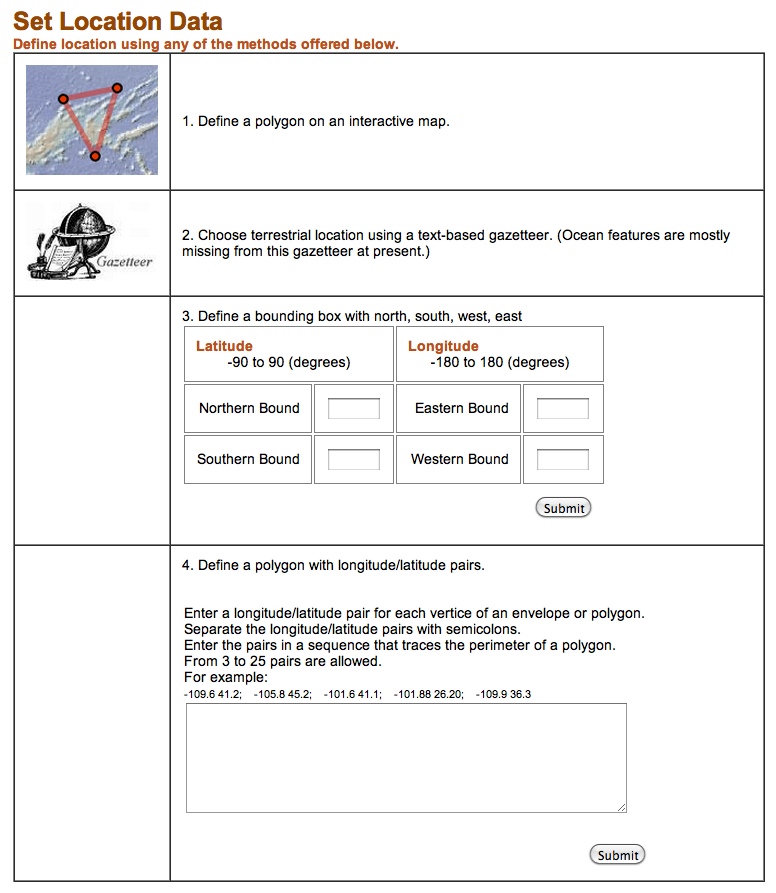
Location
You can set the location in four different ways.
- Define a polygon by clicking on an interactive map
- Choose a terrestrial location using a text-based gazetteer.
- Define a bounding box with N, S, E, W boundaries
- Define a polygon with longitude/latitude pairs
After you set your constraint and click the Submit button, the query page will show a map of your area of interest.
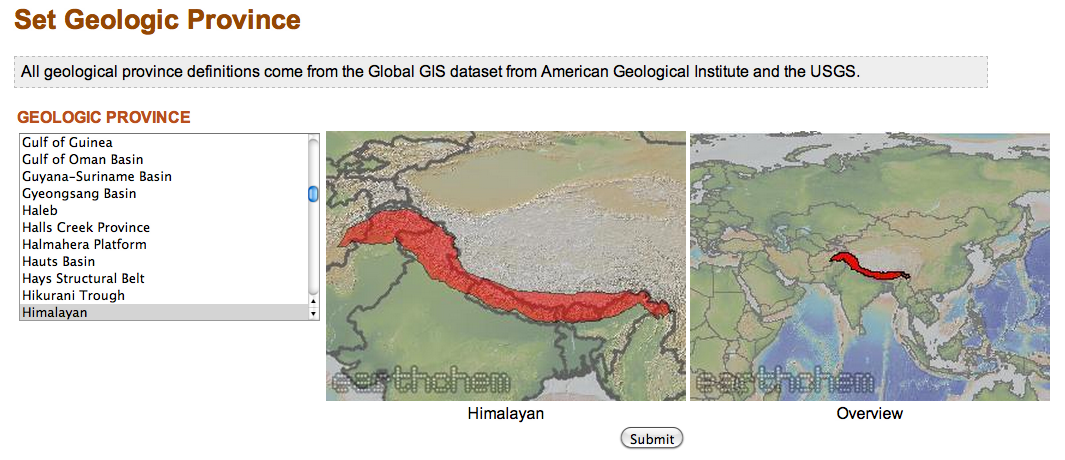
Geologic province
To select a geologic province, select a province from the list, view the map outline, then click the Submit button to set the constraint. All geologic province definitions come from the Global GIS dataset from American Geological Institute and the USGS.
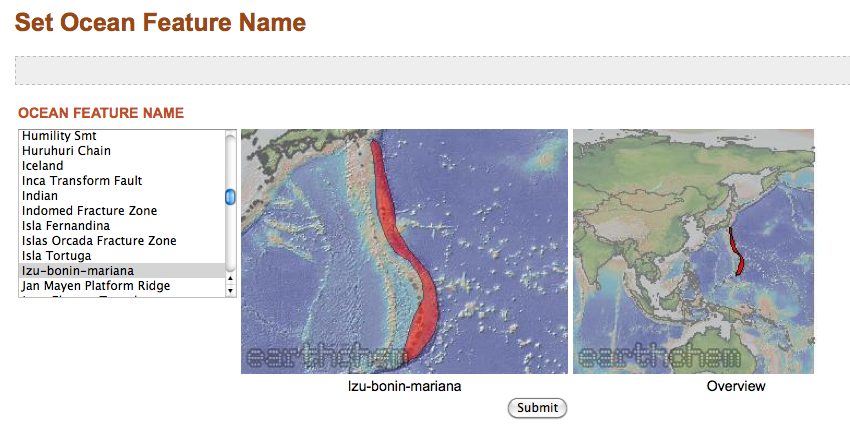
Ocean Feature Name
To select an Ocean Feature, select an ocean feature from the list, view the map outline, then click the Submit button to set the constraint. Ocean feature polygons were defined by EarthChem.
Volcano Name
To select samples from a given volcano, choose from a list of volcano names from the Global Volcanism Program of the Smithsonian Institution. Select a volcano name, view the location in a map, then click the Submit button to set the constraint. You will also be able to follow a link to the Smithsonian volcano page for more information.

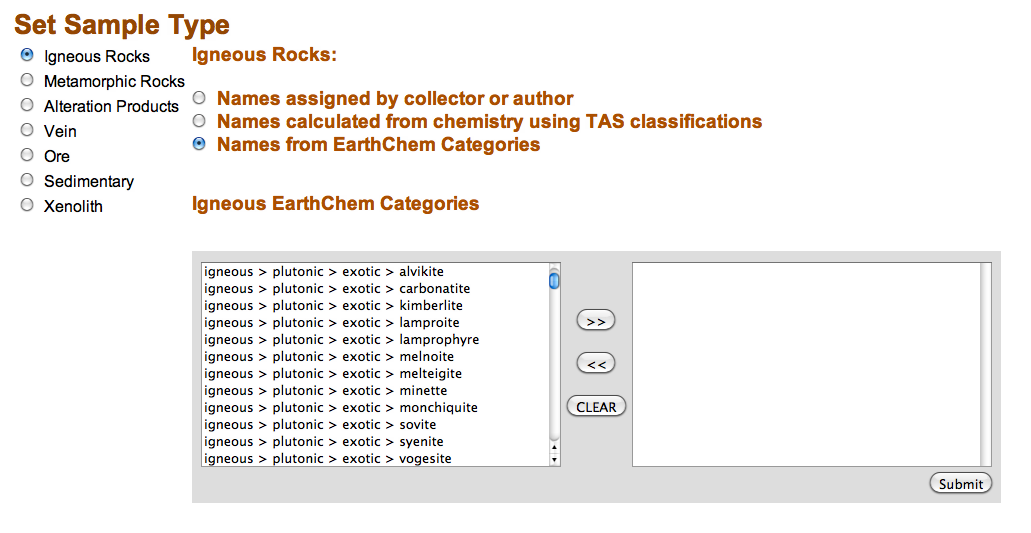
Sample Type
Under sample type, you first choose among a list of general rock types. Next, you will have the option of choosing a more detailed rock type (e.g. gabbro, amphibolite).
For Igneous and Sedimentary categories, there are more customized choices.
- Names assigned by collector or author: These names are the collector-assigned name in the publication, regardless of the chemical composition.
- Names calculated from chemistry using TAS classifications (for igneous rocks): TAS stands for Total Alkali Silica, the classification system assigns names to volcanic rocks based on the relationship between the combined alkali content and the silica content. This classification is determined by the chemical composition of the sample and disregards the author-given classification.
- Names from EarthChem Categories: EarthChem categories are a standardized naming convention that maps author-given names like “granite” to a standardized, hierarchical vocabulary e.g. “igneous>plutonic>felsic>granite”.
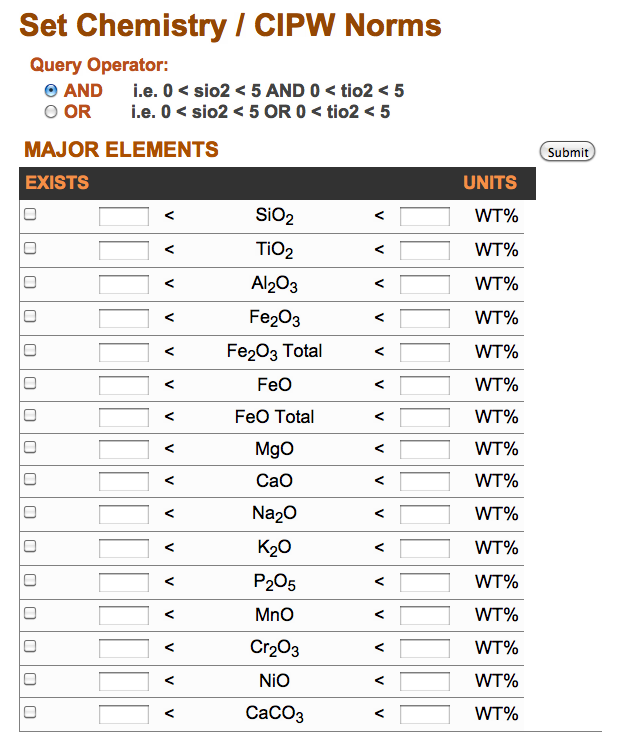
Chemistry
To constrain samples by chemistry or CIPW norms (a calculation based on the typical minerals that may be precipitated from an anhydrous melt at low pressure), first locate the parameter of interest, then click on the box for “exists”. This will automatically fill in the range 0 to 100% in the boxes and will return samples with any value measured for that parameter. If you want a narrower range, enter the lower and upper bounds of the WT% that you are interested in (e.g. 0 to 30%). This sets the constraint to return samples that have a measured value between the minimum and maximum of the parameter.
If you want to set constraints on more than one parameter, click AND or OR to combine the constraints.
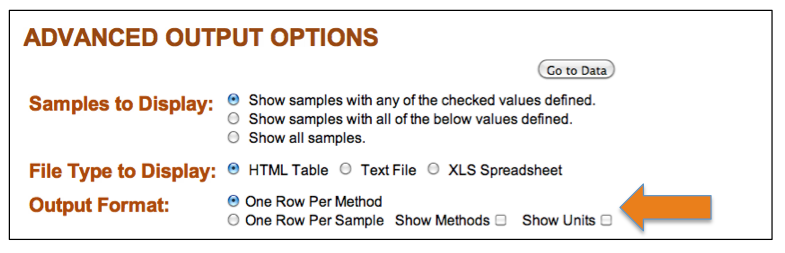
Advanced Output Options
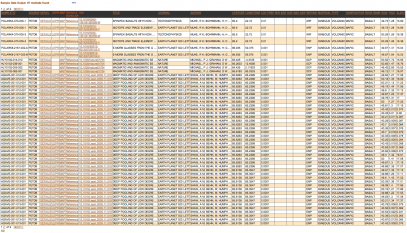
After setting the query constraints and clicking Get Chemical Data, you are presented with a number of display options for the final data table (see image to the right, click to enlarge). This page shows examples for some of the different display options, using the initial data query for Ocean Feature = Gakkel Ridge.
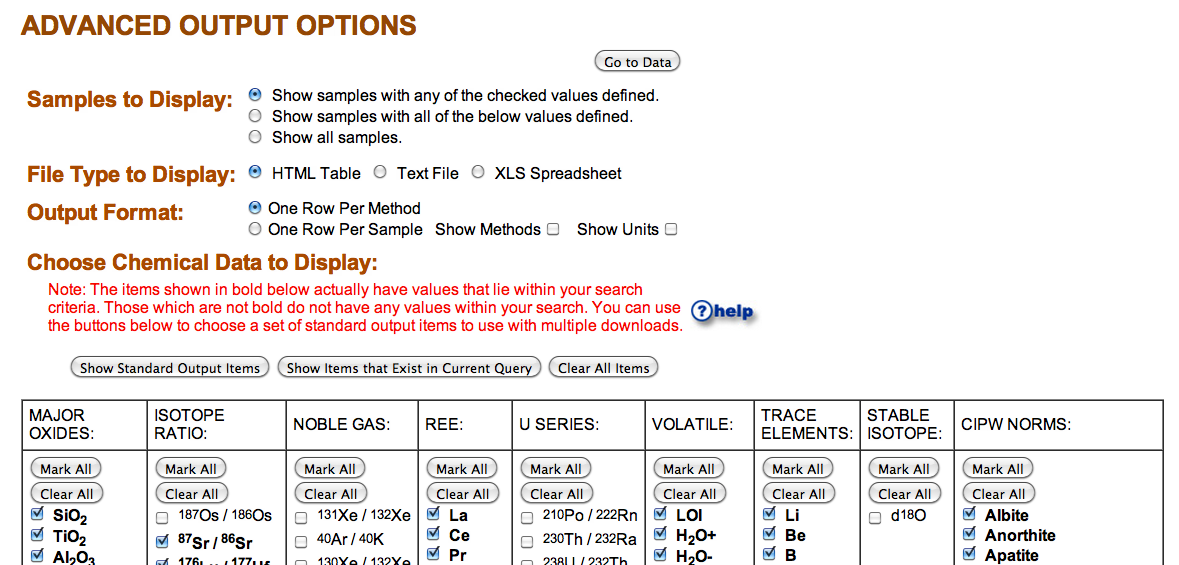
1. Default display
Under the Samples to Display section, the default display is “Show samples with any of the checked values defined“. This option will display samples with a measured value for any one of the checked parameters. The parameters are pre-checked with the “standard output” items. You can toggle this with the parameters actually represented in the query by clicking the button “Show Items that Exist in Current Query.” Even if a sample only has one parameter in the checked list defined, it will show in your final data table.
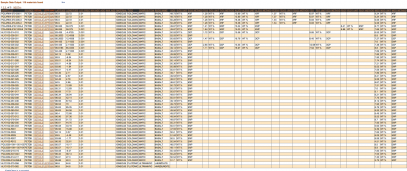
2. Show samples with all of the below values defined
Under the Samples to Display section, the second option is “Show samples with all of the below values defined.” If checked, this option will tend to decrease the number of samples displayed. You can clear all of the checked boxes by clicking the “Clear All Items” button directly above the parameter table.
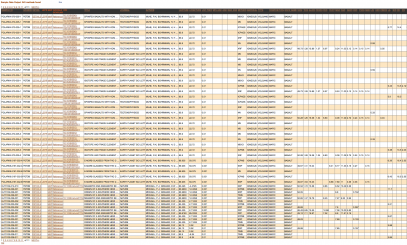
The example shows the output if the boxes are checked only for SiO2, TiO2, and Al2O3. You can see that there are fewer samples than the first example image, and every row has a measured value reported for SiO2, TiO2, and Al2O3.
3. One row per sample with methods and units
Under the Output Format section, the default option is One Row Per Method. However, you can check the option One Row Per Sample to make the table more compact. In the example to the left, the additional options for Show Methods and Show Units have been checked off. These options create additional columns to the right of each parameter column, detailing the method and unit of the measurement.
You can view data several ways. To change output option hit the ‘back’ button on your browser and select another output.
- Data Access – Download data in and HTML table, Text file, or XLS Spreadsheet. Options allow you to choose which chemical items you want displayed.
- Metadata – Choose to view a reference list or a quickly rendered HTML table of samples. Output columns are pre-determined to commonly displayed output.
- Visualization Tools Choose to explore data in various formats. including TAS Diagrams, animation (for samples with age data), Harker diagrams, XYZ plots, dynamic and static maps, or Google Earth kml output. For all options except the the static map and Google earth output, you can activate data points by scrolling down and clicking “Datapoints link to individual sample data?” followed by clicking the “Plot” button. This allows you to view the samples metadata as it appears in its native database”. See below for more details on visualization tools.
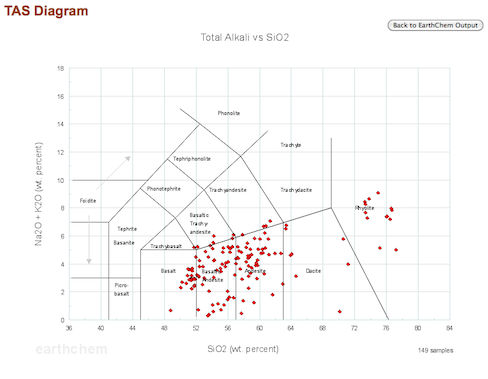
- TAS and Harker Diagram Buttons: Click on these buttons to view sample data plotted on a Total Alkali vs. Silica (TAS) diagram subdivided with the classification of Streckeisen et al. (Le Maitre, ed., 2002) or to view (Harker) plots of the compositional variation of Major Oxides vs. Silica. You may modify the size, number of plots, and symbols displayed by using tools at the bottom of the Harker diagram page.
- Static and Dynamic Maps – To view samples on a map click on Static Map. Use the Dynamic map if you would like to click on a location and to view a sample information page. However, the dynamic map works best with queries of than 100 samples.
- Plotting Tools – Create X-Y-Z plots of elements or ratios from your queried data. Explore multiple design options!
- Google Earth – Outputs a kml file viewable in Google Earth. Sample locations link to the native databases and are color-coded by database of origin.
Below are some useful features that will enhance your EarthChem experience.
1. Visualize Sample locations on Maps
The location of EarthChem samples can be visualized on a number of different maps, including static maps, dynamic maps, and Google Earth.
EarthChem’s static maps are useful for inserting in reports or other visual projects. The files are .jpeg and can be saved to your computer.
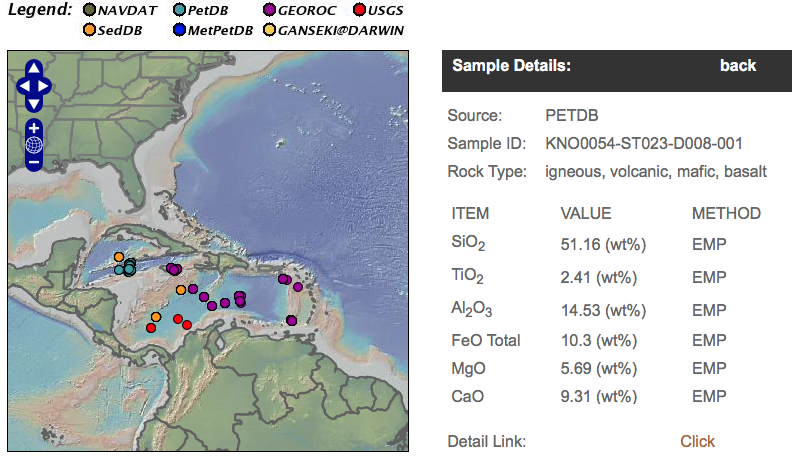
EarthChem’s dynamic map option allows you to view your query samples on a topographic map. The map can be zoomed in for closer views. Clicking on the colored dots – the sample locations – will link you to more detailed information for individual samples.
EarthChem sample location and information can be viewed in Google Earth in two ways. Once you get to your sample selection, you can download the results of your query in a KML file, then view it in Google Earth. Clicking on the sample icon brings up a window with more information about the sample.
(Note that the location precision for samples is different for different databases. Some samples may only be reported to one or two decimal places, but some may have up to six decimal places. Please be aware of this as you zoom in on samples.)
2. Visualize Geochemical data on TAS and Harker Diagrams
Once you have obtained your sample selection, you can view a TAS (Total Alkali vs SiO2) or Harker (oxides of elements against SiO2) Diagrams. Simply click on the buttons under “Visualization Tools” after completing your query.
A Total Alkali Silica (TAS) Diagram might be useful to view your sample data if you are concerned with volcanic rocks. These diagrams plot the bulk total alkalis (sodium & potassium) versus the silica content of the rocks from your samples.
Harker diagrams, or variation diagrams, are useful for detecting geochemical and genetic trends in the petrology of your samples. After clicking on the “Plot Harker Diagrams” button you will be brought to a page with a number of Harker diagrams displaying your sample data. At the bottom of the page are various options for modifying the appearance of the diagrams. You can also select an option that allows you to link directly to each data sample point’s information from the graphs.
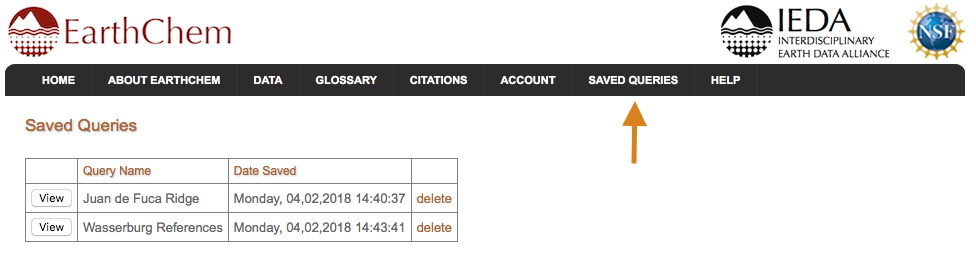
3. Save your queries for future use
Have you ever wanted to save a particular query so you can repeat it in the future? This is useful, for example, for repeating a query after EarthChem has loaded more data. You can save a complicated query with several constraints set. First, you must be logged in with a GeoPass account. Then, after obtaining your query results, simply click the “Save Query” button in the lower right hand corner of the screen, and choose a name for your saved query. The next time you want to repeat the query, log in with GeoPass and click the “Saved Queries” option in the left-hand Portal Menu to see a list of your saved queries. Simply click on the “View” button and you will arrive at your previous sample set.
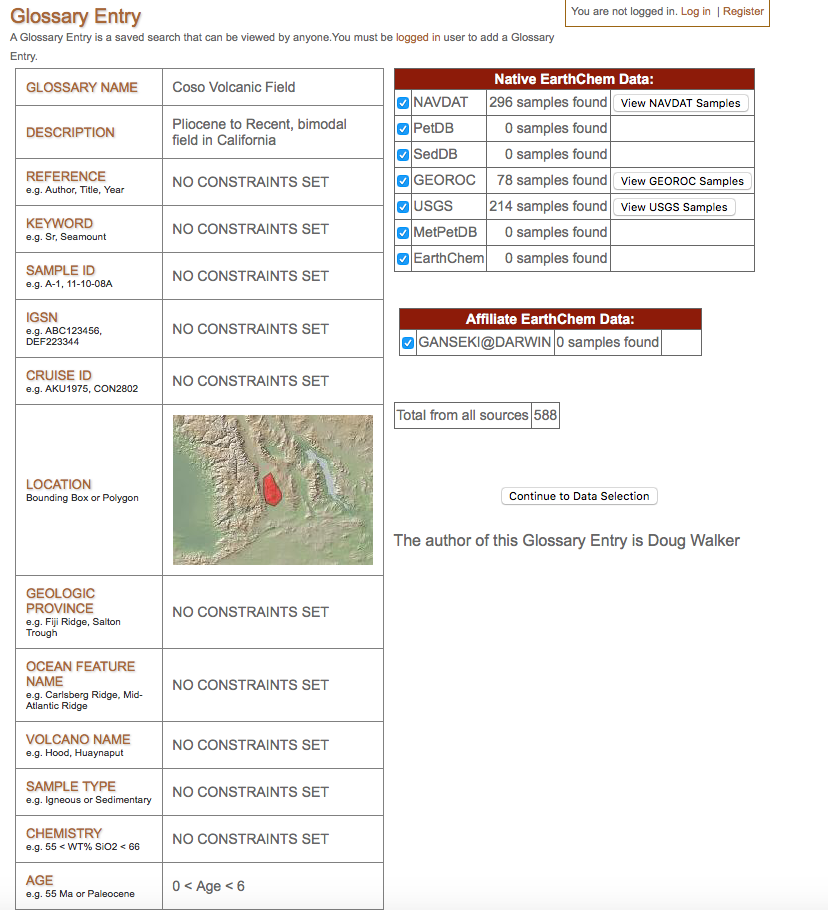
4. Save and Share your queries in the Glossary
The EarthChem Glossary allows you to share your saved queries with other EarthChem users. Currently, there are many Glossary entries that have geographic areas and/or age predefined. For example, there is an entry for Coso Volcanic Field, sample age less than 6 Ma.
To create a Glossary entry, you must be a registered user with GeoPass. Navigate to the Glossary page by clicking “Glossary” in the left-hand Portal Menu, then click the button at the top “Add Glossary Entry.” You will see a page where you can set the name of the Glossary entry, the description, and edit the constraints of the query.
When you first create a Glossary entry, you will be the only user who can see it, and you can edit or delete the entry. Upon creation of an entry, an email notification is sent to the EarthChem Portal developers, and they review the Glossary entry for appropriateness and then publish the entry on the Glossary page.
5. Advanced Data Display Options – showing units and methods
EarthChem Portal has several options for displaying geochemical output. Did you know that you have different options for displaying measurement units and analytical methods?
For example, because the data is compiled from different databases, you may want to see what Unit of measurement is being reported. You can achieve this by clicking on the “Show Units” option in the “Advanced Output Options” screen. Another column will be added to the output table that lists the unit. The same can be done for Method. The default is that the output table displays one row per method, which consolidates rows but does not allow for the unit or method display options.
Resources for Developers
EarthChem REST Service
The EarthChem REST Search Service accepts GET string variables which determine search criteria.
The target URL for the EarthChem REST Search Service is:
http://portal.earthchem.org/restsearchservice
EarthChem WFS Service
The EarthChem WFS Service is a full transactional implementation of the OpenGIS Consortium’s Web Feature Server specification.
The following layers are available:
- Isotopes
- NobleGas
- RareEarth_Element
- StableIsotopes
- Trace_Element
- U-Series
- VolatileGas
- WR_Major_Element
The EarthChem WFS Service can be found at:
http://portal.earthchem.org/wfs/ows?service=wfs&version=1.0.0&request=GetCapabilities
EarthChem XML
The EarthChem Portal serves PetDB data published in a standard XML and served via XML-based web services. An XML schema has been developed as part of the EarthChem project to publish Geochemical data. The schema includes metadata such as location, reference, chemical data, and controlled vocabularies (ontologies) for validation.
Data Models
The EarthChem team have been involved in the development of data models such as the Observations Data Model 2 (ODM2) (Horsburgh et al. 2016). ODM2 forms the basis of EarthChem data syntheses, in part because of the flexibility to include both specimen-based and time series measurements.
The original PetDB data model is described in Lehnert et al. 2000.